Identifying and locating utility pipes at moderate depths with GPR
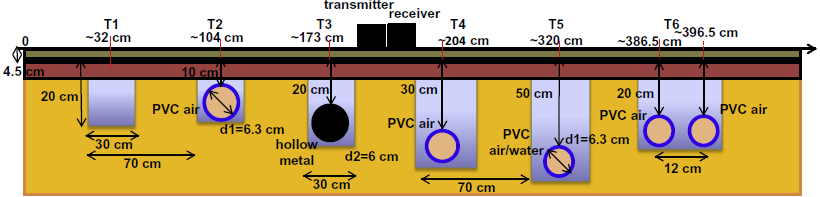
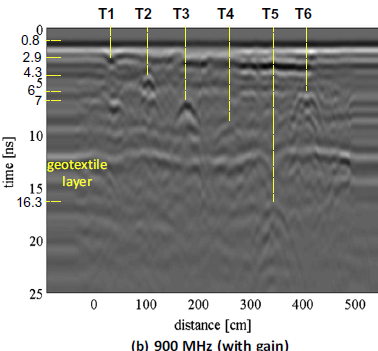
Sagnard et al. (2016) demonstrated excellent GPR utility detection at a test site where air- and water-filled pipes were buried at different depths in parallel trenches. A cross-section of the site (Fig. 1) shows PVC and metal pipes buried at depths of 6-25 in. and spaced by 30 in. In the 900 MHz GPR profile of the test site (Fig. 2), all pipes are represented by hyperbolic reflections. Trench T1 has no pipe and its GPR shows no hyperbolic reflection. Bright reflections mark the top and bottom of T1 because backfill permittivity contrasts with that of the ground material. The two air-filled, PVC pipes in trench T6 at 14 in. depth are separated by 5 in. and clearly distinguishable in the 900 MHz GPR profile.
Fig. 1. Cross-section of GPR utility test site shows trench T1 with backfill only (no pipe) and 5 trenches (T2-T6) with pipes. The pipes have an OD of ~2.5 in. and are buried at depths of 6 – 25 in. Pipes in T2, T4, T6 are air-filled PVC. Pipe in T3 is air-filled metal. Pipe in T5 is water-filled PVC. Trenches are overlain by asphalt.
Fig. 2. 900 MHz GPR profile of GPR utility test site in Fig. 1. Axes are lateral distance vs two-way travel time in nanoseconds (ns). Profile shows reflection hyperbolas for the pipes in trenches T2- T6 and reflections for the empty trench T1. Horizontal GPR reflection horizon at a time of 12 ns or depth of ~1.2 ft is a geotextile layer added as the site was built.
Identifying and locating highly variable utility pipes at shallow depths with GPR
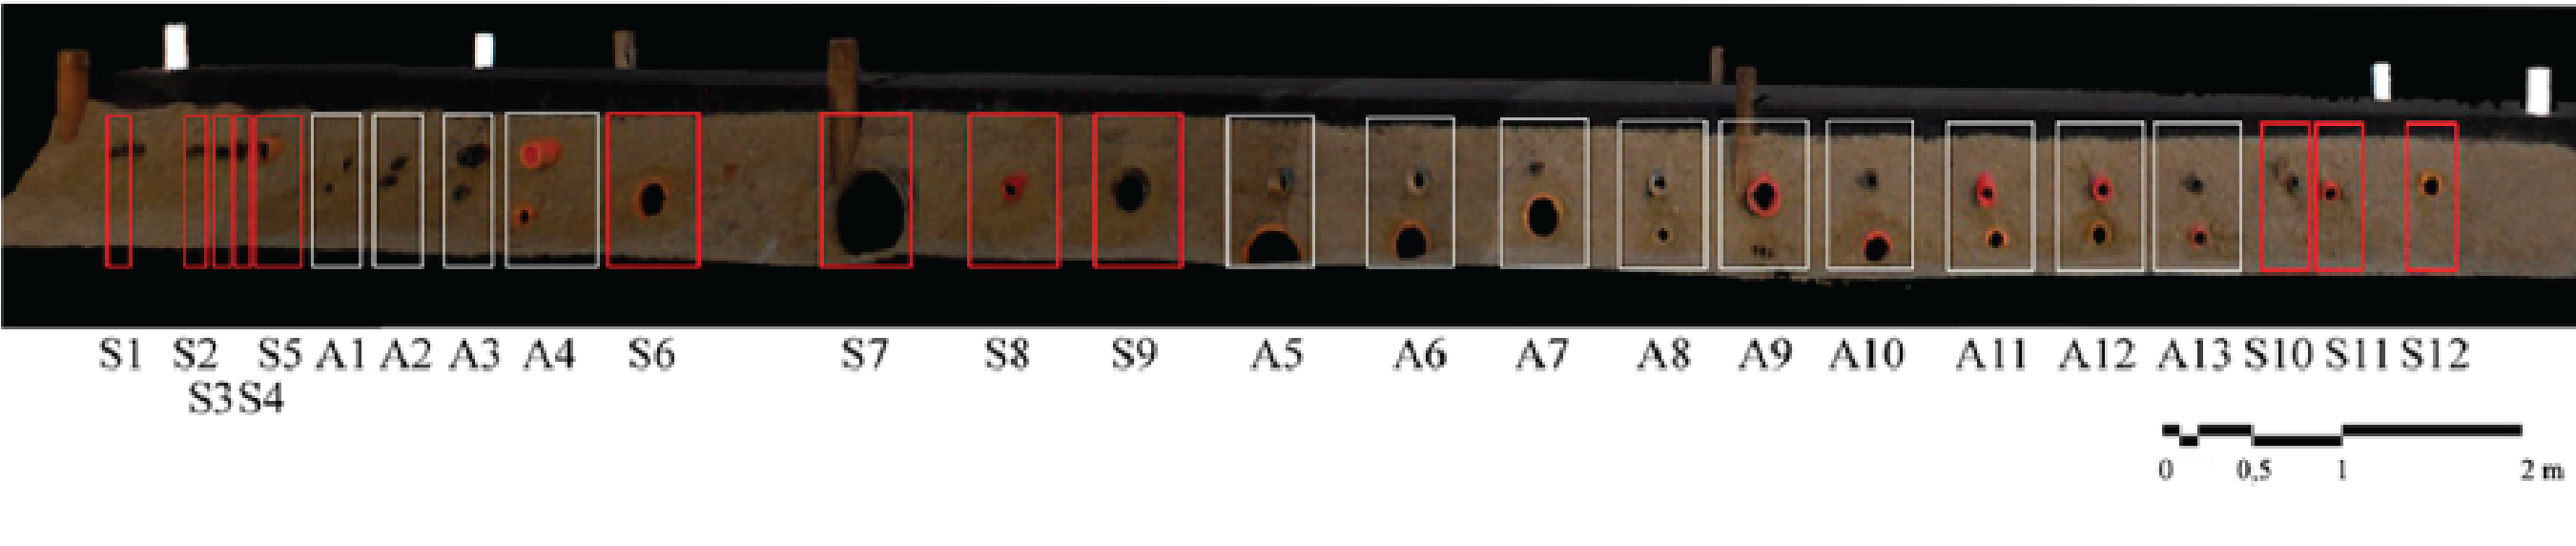
Prego et al. (2017) demonstrated that GPR detects utilities using air-filled pipes made of many materials buried at depths of 1-2.5 ft in a GPR-test mound (Fig. 3). Twelve “S” zones contain single pipes (outlined by red boxes); 13 “A” zones contain two adjacent pipes (outlined by white boxes). Pipe diameters range from 1 in. (S1, S2, and A1) to 20 in. (S7). The horizontal distance between pipes ranges from 4 in. between pipes in S10 and S11 to 24 in. between pipes in A5 and A6. The vertical distance between pipes ranges from 3 in. (A7) to 7 in. (A10).
Fig. 3. Cross-section of 46 ft long GPR test mound with a wide variety of buried pipes. Mound is 3.3 ft thick and composed of 2.5 ft of compacted aggregate overlain by 4 in. of intermediate course aggregate capped by 2 in. of surface course asphalt.
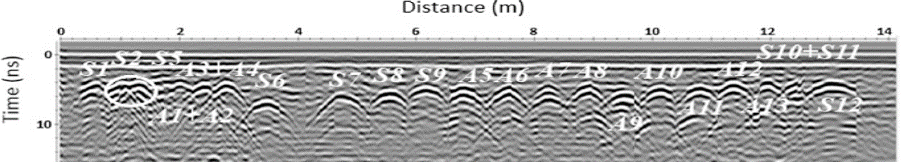
Fig. 4. 800 MHz GPR profile of buried pipe test mound of Fig. 3 shows hyperbolic reflections for the pipes in each of the trenches. Axes are horizontal distance in meters versus two-way travel time in nanoseconds.
The 800 MHz GPR profile in Fig. 4 shows hyperbolic reflections for all pipes in Fig. 3. The hyperbolic reflection at S1 represents a polyurethane pipe of 1 in. diameter at 1.5 ft depth. Hyperbolic reflections representing a 6.3 in. diameter pipe overlying a 2.5 in. diameter pipe at a depth of 2 ft are both apparent in zone A9. Pipes in S10 and S11 are only 10 in. apart but the overlapping hyperbolic reflections that represent them are distinguishable. However, where 4 in. diameter pipes are less than 4 in. apart, such as in S2 – S5, individual hyperbolas cannot be identified within the clump of hyperbolas that represent them. This is beyond the resolution of the 800 MHz antenna. Pipes separated by 20 in. horizontally (S8-S9) are represented by hyperbolic reflections that are fully distinguishable. Hyperbolas representing pipes separated vertically by as little as 3 in. (A7) are separable. In zone S7, both top and bottom of the 20 in. diameter pipe are apparent.