Ground-Penetrating Radar (GPR)
The substances that make up utilities (water, metal, air within pipes, etc.) and surrounding earth and construction materials have different “permittivities”, an electromagnetic (EM) property that can be thought of as “polarizability”. GPR pulses, which are EM radiowaves, travel downwards from an antenna at the surface, reflect off subsurface interfaces between materials that have differing permittivities, and return to the surface antenna where they manifest on a GPR record as bright stripes or spots. The permittivity contrast between a pipe or its contents and the surrounding material is represented on a GPR profile collected by moving the GPR antenna over the utility as a hyperbolic-shaped reflection (upside-down U). For example, look at the hyperbolic reflections in the two GPR profiles below. What you are seeing is reflected energy in a graph of lateral distance travelled by the GPR antenna (horizontal axis) versus two-way travel time of the radar pulse (vertical axis). These profiles show hyperbolic reflections typical of utility pipe crossings.
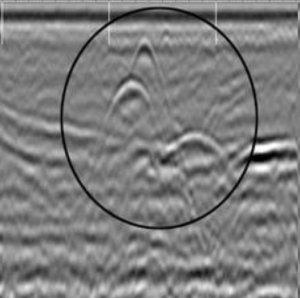
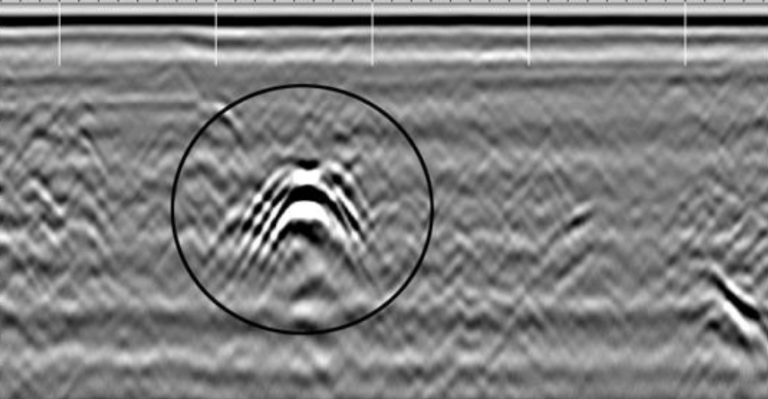
400 MHz GPR of a bank of conduit pipes adjacent to an industrial building. Pipes are represented by several bright, stacked hyperbolic reflections in circle. Source: GSSI.
Radar waves travel at the speed of light and so travel times of radar waves are measured in nanoseconds (ns). Because wavelengths of the radar pulse are very short, GPR achieves very high spatial resolution. For example, a radar wave transmitted at 900 MHz has a wavelength of ~15 cm or 6 in. Analogous to the seismic reflection technique, radar wave travel times, typically between 0.03 and 0.3 m/ns, are related to depth in the ground based on knowledge of wave velocities.
A GPR system consists of a GPR computer-controller and different GPR antennas. GPR antennas transmit and receive EM pulses at different frequencies. The lower the frequency at which an antenna transmits and receives, the longer is the wavelength of the EM pulse and so the lower is its spatial resolution. However, longer wavelength EM pulses penetrate to greater depth than shorter wavelength pulses.
When GPR profiles are collected along many transects arranged as a grid, a 3D cube of GPR data can be assembled and then sliced at particular depths to reveal the map patterns of utility-lines at those depths. For instance, the right-hand image in the figure below is a horizontal slice through 3D data at a depth of 2 ft. GPR reflection amplitudes at this depth show utility lines as white lines interrupted by a rectangular trench that was backfilled and so bright relative to surrounding material. The left-hand figure below shows a single GPR profile (vertical slice) of the many collected to produce the map on the right. This profile shows several utilities as narrow, bright black and while spots as well as the base of the trench a depth of 60 in. as a black-white-black reflection horizon.
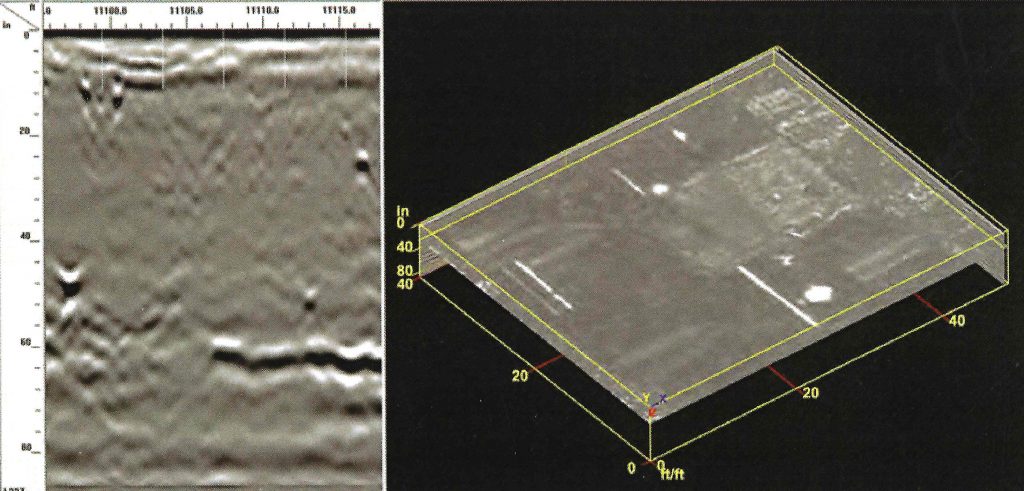
GPR radargram (left) and amplitude map (right) of 50 ft x 40 ft area showing several utility lines (bright while lines) on a horizontal slice at a depth of 2 ft. One utility line is interrupted by a filled rectangular trench. On left is one of many GPR profiles used to construct the map that shows several utilities (small, bright white-and-black spots) above a flat reflection horizon at 60 in. that represents the trench floor. Data collected with a 400-MHz antenna. Source: GSSI.
Advantages and disadvantages of using GPR to locate utilities are listed in Table 1. The take-home point is that GPR is the preferred method to locate both non-metal and metal utilities.
Table 1. Advantages and disadvantages of GPR for utility locating.
Advantages
Reliably images most if not all utilities to any normal utility depth, not simply metal conductors. |
Provides utility depths with high accuracy. |
Distinguishes utilities as close as 4” vertically and 6-10” laterally. |
Identifies metal, ground disturbance, pipe leaks, miscellaneous buried objects. |
Disadvantages
Takes more field time than EM induction techniques and post-processing is highly recommended. |
Data about ground subsurface is needed to achieve high spatial accuracy. |
Penetration depth is limited in clay-rich, highly conductive environments. |
Detects anomalies (e.g., rocks, roots) not related to utilities that require interpretation. |